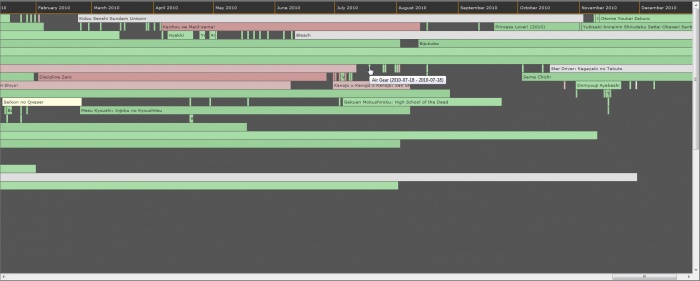
MyList Timeline
Jump to navigation
Jump to search
What it does

The MyList Timeline is a page that shows a graph of your watched anime history. Each watched anime is represented in a timeline with a bar based on the date when you watched the first episode of the anime and the date when you watched the last episode of an anime.
| Note | Episodes watched after you already have watched the anime completely do not alter the timeline |
The timeline is generated automatically based on when you marked episodes as watched, unless you manually edit the anime's state.
| Note | These statistics are not updated real time, see Routine Maintenance, exception being manual edits. |
Each anime is displayed with a different color based on it's state:
- Green represents completed anime.
- Red represents stalled anime.
- Light gray represents watching or unknown anime.
- Yellow represents dropped anime.
You can hover your mouse over a bar to see the title of the anime with the watched date range. Clicking on the bar will take you to the anime entry.